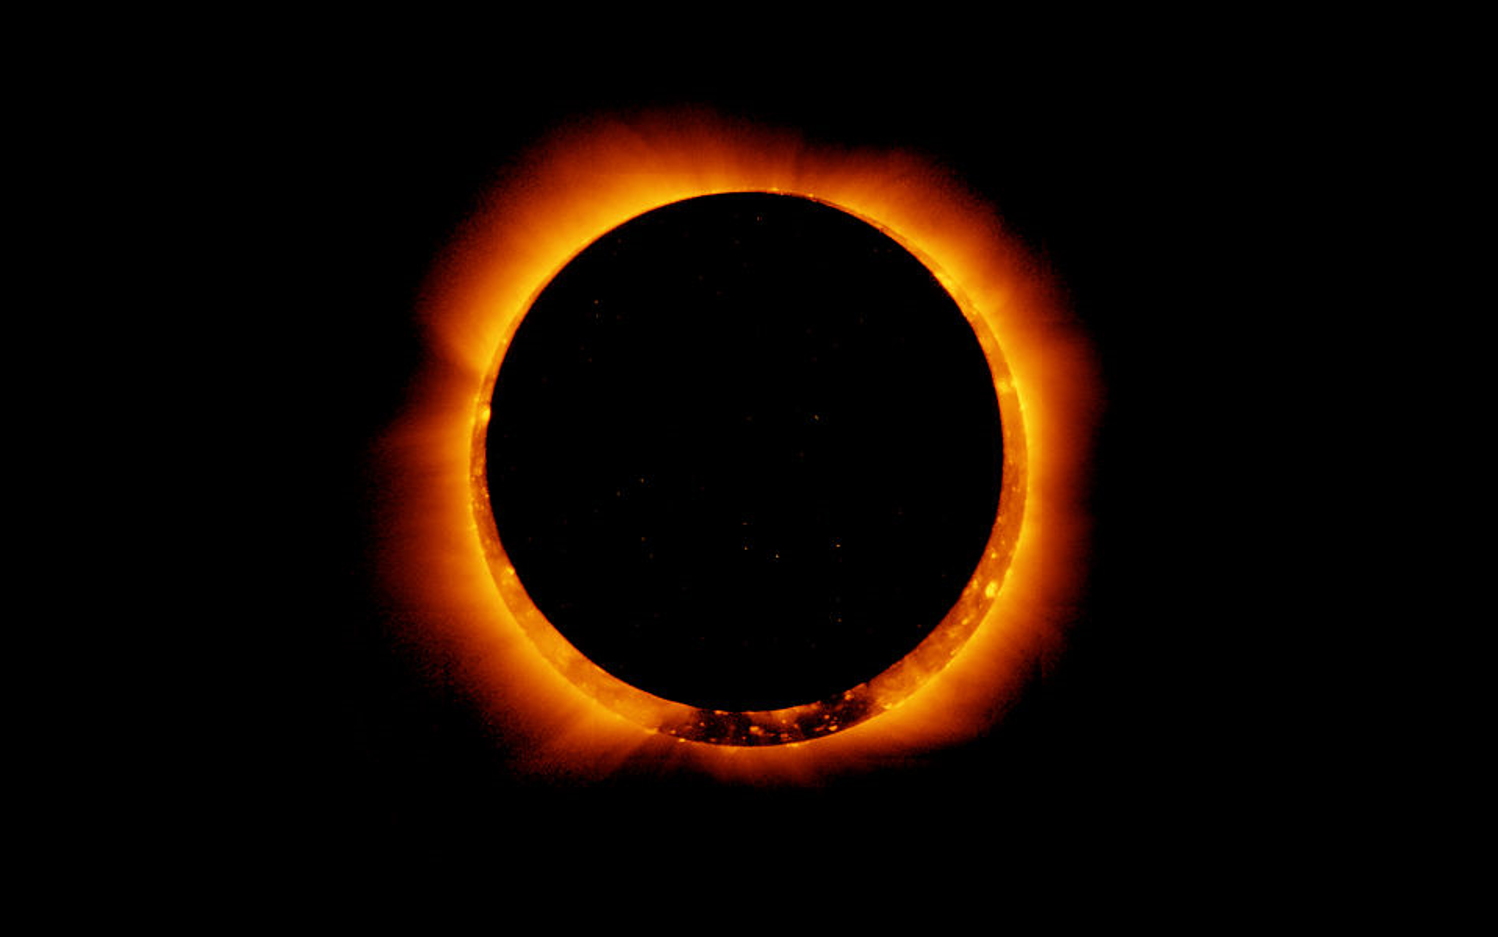
Eclipse 2017 Cross-Country Temperature and Humidity Data

The graphs below show data collected from the various sites in a 24-hour period around the time of the eclipse. For most
sites, this is a subset of the multi-day data available. Full data can be downloaded for each site at the links below.
For those downloading data for further or different analysis, please note the following:
- You are free to use this data for any purpose. Please acknowledge us as "FiskeTech 2017 Eclipse Temperature & Humidity Data", eclipse.fisketech.com.
- Each site was hosted by volunteers. Different sites collected for different amounts of time based on the
local conditions and the individual hosts' schedules.
- The columns in the raw data files are
- The Ft. Collins unit was hit by a sprinkler overnight August 20 to August 21. That accounts for the
relative humidity readings over 100%.
- The Ft. Collins sensor also dropped about a dozen readings during its overall operation. Those have been filtered
from the data shown in the graphs, but they are included in the raw data files. They are identifiable by temperature
values in the vicinity of -50° C or 100° C.
Participating Locations
Graphs and Downloads
Click the city name to download the full data set in CSV format, with columns described above. The graphs
show available data in a 24-hour period around the eclipse. Some sites have additional data in the raw data files
as also described above.
Volunteers
Thank you to everyone who participated in the experiment as a site host or in preparation of the units. In addition
to several who chose to remain anonymous, the group includes (in alphabetical order):
- Arzu Ozbek Akay
- Jyotsna Dabbi
- Riya Dabbi
- Matthew L. Ferguson
(Assistant Professor of Physics, Boise State University)
- Donna Fiske
- Franklin Fiske
- Roger Fiske
- Mahati Gollamudi
- Venkata Ramana Gollamudi
- Leon G. Higley
- Phyllis M. Higley
- Will Maraulja
- Violeta Prieto
- Leo Stasevich (Ridgeview Classical Schools)
- Tim Stasevich
(Colorado State University, Department of Biochemistry & Molecular Biology)
- Srivatsa Valluri
- Vasu Valluri


